A new frontier – using tech to map further and faster
Wednesday, 8 April, 2020
In this new world order, the way we do things is changing daily. We’re learning to adapt quickly and vegetation mapping is one area where we’ve already worked with clients to make their projects more efficient and cost effective. Gone are the days of arduously scaling whole landscapes to map gnarly features; nowadays mapping is a high-tech exercise. ELA’s experts are using technology to accurately map hard to reach places, deliver projects more efficiently and helping clients go further than they’ve ever gone before.
New 3D mapping and modelling capabilities have proven extremely useful in analysing bushfire risk and land degradation, mapping vegetation in new developments and assessing threats to species.
“New technology allows us to accurately model and understand a landscape and its features in super-fast time” Senior Environment Consultant, Robert Mezzatesta says.
“We can then go in the field to confirm various findings rather than starting from scratch. Once we understand a landscape, we can analyse and model all sorts of variables and their impact.”
Mapping is traditionally a slow process with extensive manual work and sometimes moderate accuracy. ELA’s experts are constantly finding ways to use technology to improve accuracy, process complex scenarios and reduce lead times and costs.
Here are three examples of ELA mapping projects where we’ve found innovative ways to map and model challenging landscapes, from urban to remote.
1. Bushfire Strategic Plan for Hornsby Council (Stage 1)
For this project, Hornsby Council in Northern Sydney were looking to gain a better understanding of how bushfires could affect their region and the bushfire risk posed to residents.
“At the time it was difficult to navigate the complexity of factors affecting bushfire behaviour and conditions.” Says Robert.
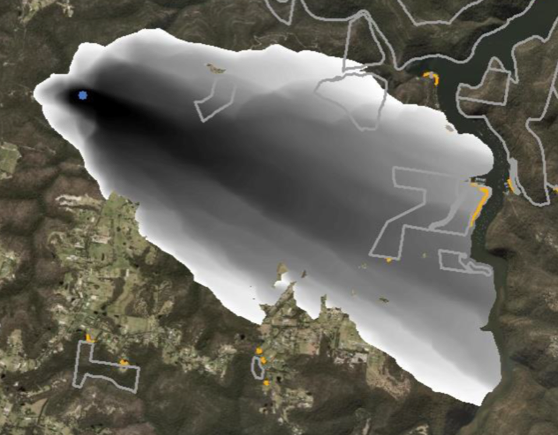
To help Hornsby Council get a step ahead, ELA utilised SPARK, a state-of-the-art bushfire modelling software package, which ELA have been involved in the development of with the CSIRO. Combining this software with existing data for Hornsby and GIS mapping systems, they predicted potential bushfire scenarios and how they might behave.
“Firstly, we established an analysis scope that had three main components: the potential landscape scale exposure to bushfire based on modelling of 4320 bushfire spread predictions; locality scale risk based bushfire intensity modelling; and building risk based on assessment of bushfire attack level (BAL)” Robert explained.
“We then analysed historical weather data to understand when high risk conditions could present themselves and the potential nature of those conditions.”
Inputting a whole range of variables down to the vegetation type and the amount of fuel load, the SPARK program accurately modelled thousands of simulated fire events, how they would spread and even the intensity they would burn. Without this software, reasonable consideration of this many potential scenarios would not be possible.
The approaches used in this project, alongside ELA’s bushfire expertise, have made it possible for Hornsby Council to better understand the bushfire risk posed to the community and to therefore allow for more informed risk management planning and decision making.
2. Frenchs Forest Tree Canopy Audit (2018)
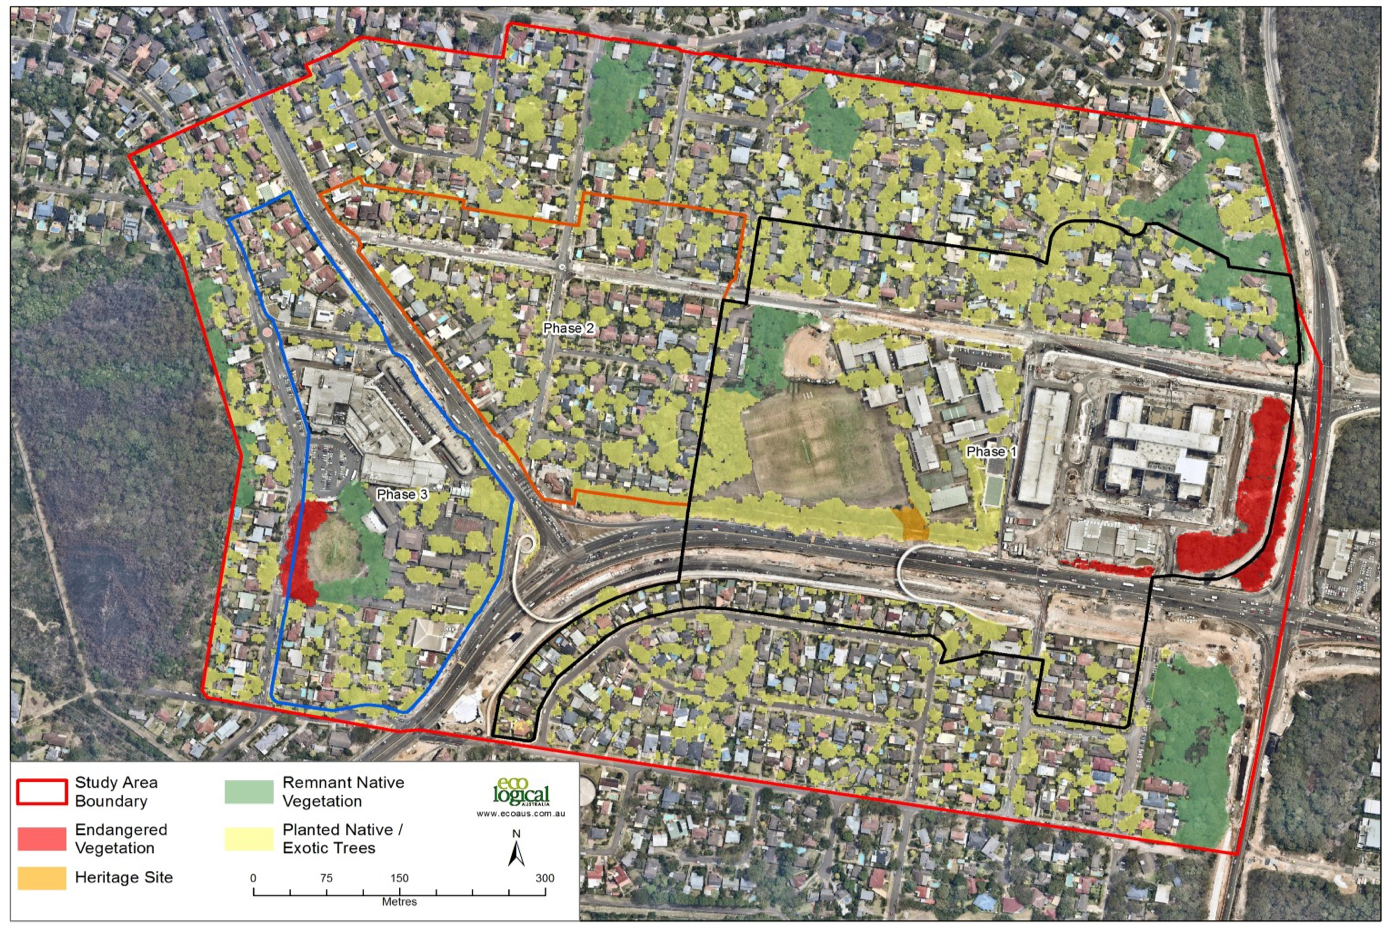
Before approving a major development proposal, the NSW Department of Planning and Environment urgently needed information on how the development could impact the local vegetation and aesthetics of the tree canopy for local residents. Usually, Rob and his team would have had to go through multiple stages of mapping, including extensive field surveys. Knowing this wouldn’t suffice, they employed a more innovative approach.
“For quick turnaround, we utilised the LIDAR (light detection and ranging) system.” says Rob.
“A plane flies over the site and measures millions of points on the ground using a sensor, to get a detailed picture of the topography on the ground.”
This system accurately measures the height of trees and vegetation allowing ELA to identify what stage the trees are at in their lifecycle.
“LIDAR has been around for about five to six years but was previously very expensive, it’s now very affordable and a great way to get highly accurate data fast” explains Rob.
The LIDAR information enabled ELA to hone their expertise on analysing and interpreting the highly accurate data provided rather than spending extensive time in the field. As a result, ELA’s report on how to manage the local vegetation was delivered in rapid time and with high accuracy.
3. Manning River wetland mapping, MidCoast Council (2018)
The Manning River winds 216 kilometres from the Barrington Ranges through the Mid-North Coast of NSW and out to sea.
“Manning River’s coastal catchment is home to a large system of wetlands which are vitally important to the NSW ecosystem and they provide a range of services including capture and storage of floodwater, nutrient cycling, and sedimentation.” explains ELA Principal Ecologist, Martin Sullivan.
This study has been undertaken to produce a highly accurate coastal wetland map, previously unavailable to MidCoast Council, to gain a more detailed understanding of how to protect and utilise these ecosystems.
Due to the sheer scale of this project and difficulty of access, ELA needed an innovative approach to create highly detailed and accurate maps that could act as a single point of reference for the area. Traditional methods for mapping such as stereoscopic aerial photos and extensive field surveys are time consuming and costly. Martin and his team decided to innovate…
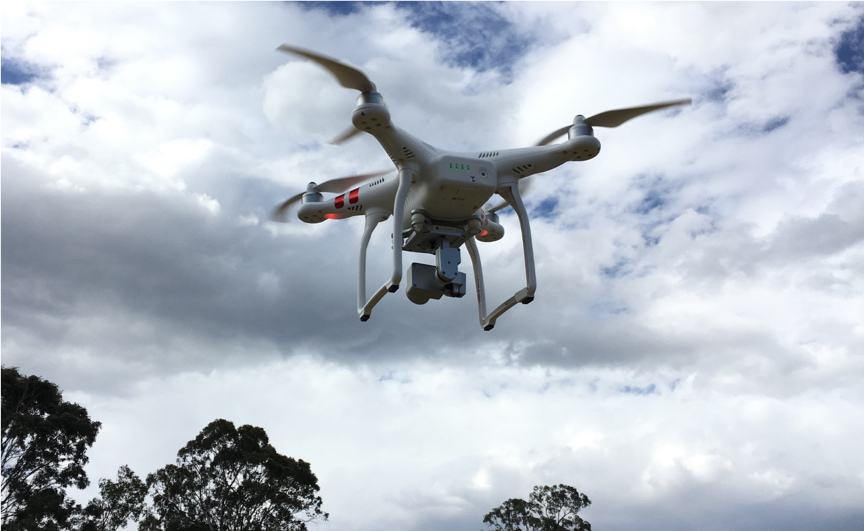
“We used three-dimensional aerial photographic interpretation in conjunction with digital elevation and surface models to provide an overview of the area and then we used drones in the field to inspect in more detail areas of interest that previously couldn’t be reached on foot.” said Martin.
This integrated use of technology not only allowed previously unreachable areas to be mapped, it also enabled ELA to provide the MidCoast Council with maps over five times more accurate in a fraction of the time and cost. These maps are now the primary source of reference for policy making regarding the protection and utilisation of the Manning River wetlands.
These are just a few examples of how ELA’s experts have been using technology to help overcome a whole variety of inherent barriers in mapping.
“Every mapping project is different and it’s exciting each time to see how we can employ technology to aid our expertise in getting results we couldn’t before.” says Martin.
Contact us on 1300 646 131 to assist.
Robert Mezzatesta
Senior Environmental Consultant
Ph: +61 400 373 037
RobertM@ecoaus.com.au
Martin Sullivan
Principal Ecologist
National Disciple Lead – Ecology & Impact Assessment
Ph: 0413 351 359
martinsullivan@ecoaus.com.au